Predicting Customer Churn

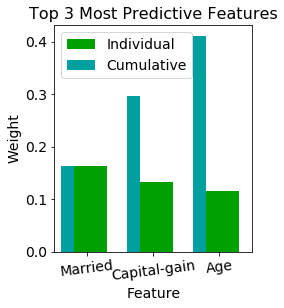
I used Spark to predict churn (customers stop using the service) of a music streaming company based on 12GB time series data. I found that churn corresponds to users who have received too many advertisements, are unsatisfied with the songs, and have younger accounts.

Toolkit: Supervised Learning (classification), Python, Spark, AWS

Check it out here

Analogy of churn to a leaking bucket

Classifying Disaster Response

I used natural language processing (NLP) and supervised machine learning to classify social media messages for disaster events into 36 categories based on tweets data. On top of that, I built a command line application and a web dashboard where users can input new tweet and view classification results.

Toolkit: Supervised Learning (classification), NLP, Python, SQL, HTML/CSS/JavaScript

Check it out here

Word cloud of social media messages

Chicago Airbnb Data Analysis

I used open source Chicago Airbnb data to seek business insights for the company. I found that, in addition to the number of rooms, the neighborhood also strongly affect rental price. High prices were found in downtown Chicago with close proximity to places of interests and Lake Michigan, as well as in areas close to the airport.

Toolkit: Supervised Learning (regression), Statistics, NLP, Python, Tableau

Check it out here

Airbnb rental price by neighborhood

Movie Recommender System

I led a team of 6 people to build an interactive dashboard that is able to provide personalized movie recommendations to the users. I was extensively involved in data cleaning and machine learning, learnt movie recommendation algorithms from different online sources, and taught what I learnt to my team so we were able to proceed in parallel. My team was able to successfully launch the interactive dashboard within a tight deadline of 2 weeks.

Toolkit: Machine Learning (PCA, clustering, collaborative filtering), NLP, Python, SQL, HTML/CSS/JaveScript

Check it out here

Screenshot of dashboard frontpage

Image Classifier

I used convolutional neural network to train an image classifier that is able to identify 102 flower species from photos. The classifer has achieved 93% testing accuracy. On top of that, I built a command-line application for model training and prediction.

Toolkit: Deep Learning, Python, PyTorch, GPU

Check it out here

Image of flower with its name

Visualizing Chicago Traffic and Pollution

I led a team of 4 people to build a web dashboard that retrieves real-time and historical data and visualizes the traffic and air quality of Chicago. I was extensively involved in data extract-transform-load (ETL) and building the real-time dashboard. My team was able to successfully launch the visualization dashboard within 2 weeks.

Toolkit: Python, SQL, MongoDB, HTML/CSS/JaveScript

Check it out here

Part of the real-time dashboard

Finding Donors

I used multiple supervised learning algorithms to predict potential charity donors based on census data. This involves full analytic cycle from data wrangling, model selection and tuning, to results evaluation.

Toolkit: Supervised Learning (classification), Python, Scikit-learn

Check it out here

Image of top 3 most predictive features

Healthcare Insights

This project explored U.S. healthcare quality at county level by visualizing relationships between population, number of hospital, patient experience rating, and mortality rate. As a lead team member, I led data analysis and visualization. I have also identified various data sources, and performed data cleaning.

Toolkit: Python, Matplotlib, Plotly, Seaborn

Check it out here

Relationship between hospital size and population by county